Thursday, March 25, 2010

Patience or Swift Trading?

I just know that this streak is going to break in my favor - it is a matter of time. If I were a swift enough trader, I would have exited and entered positions up and down this last 12 months. Reality is that I am not swift enough. So instead on days like today, I remain patient while everyone else panics. You can feel a top in the air. The final throws off this rally are underway. Look for big selling waves into the frothy bull mania. You can see it now if you watch the blocks carefully.


While I posted, 1172 was hit. Now we see if it holds:

Wednesday, March 24, 2010

Some Weakness...

This is not a day to celebrate - though it is nice to see a down day every so often. Anyway, I think we go lower tomorrow to test support at the bottom trend line. That is the test to see where we are headed. If we bounce off that line tomorrow and close higher. I will close my newest shorts. I did take my profits on my JCP and SWKS shorts today.

Tuesday, March 23, 2010

Short! Short! Short!

March madness has new meaning for me. It is absolutely amazng how over driven the market can get in either direction. I have stopped watching the market on a minute by minute basis. Primarily to preserve my sanity - but more importantly, to preserve my short positions. I did watch the market today and was so very impressed by the move up and I am now convinced that we are in for a very viscious fall. So much so that I have doubled my short position in anticipation of the move. Wow! I just can't see the market advancing much more. At best, we grind a bit higher only to shed 10% -15% in the near term. No need for deep technical analysis here.

Tuesday, March 16, 2010

1250 Bound?

Here is a quick reaction to the day. I have not been in a position to watch the markets or react to the markets due to other significant responsibilities in my business portfolio. Having said that, I am glad as I do not think I could stomach much of this in real time.

Friday, March 12, 2010

Mid-day Thoughts on SPX...

Decided to talk about a basic pattern that repeats itself often. No guarentee that I will be right, so please keep in mind it is just a mid-day observation. Trade at your own risk fellas!

Thursday, March 11, 2010

Test Video Post

I am trying out a new format for the posts - video. I am hoping this will make regular posting more efficient. This first post is really a technology test - meaning I have spent all of 5 minutes doing TA on the charts and the rest of the time resolving technical issues. Safe to say this first post will suck. Let me know what you guys think.

Thanks

BEST BET IS TO CLICK ON THE FILE NAME OR DOUBLE CLICK ON VIDEO TO LAUNCH YOUTUBE PLAYER

Wednesday, March 10, 2010

Analysis of the Hourly....

Open the hourly chart for the SPX:


The chart features include:


  • The distinct up channel with Red Upper Trend Line Resistance and the Green Lower Trend Line Support.

  • The Green Lower Wedge Support line

  • A Fib Grid from the last touch of support to the recent touch of resistance

  • Several yellow support levels each labeled for clarity

  • 20p MA in Pink

  • 50p MA in Baby Blue


We are clearly traveling in an up channel that seems to be wedging out. If you compare the RSI at the prior point we touched the upper channel resistance with this last touch, you will note divergence. Now look at the Bollinger Bands. They have constricted and flattened in the last several hours of trade after being pierced to the upside. This shows participant indecision and a possible shift in price direction may occur.

One possible short term setup is to trade the channel as it presents itself. Considering how close we are to the high of the year and where we sit in the current channel, a short with a stop above yesterday's high could be profitable. A safer short would be at the breach of the lower wedge support with a tight stop after the retest of the line. Once 1035 is broken I would expect a test of the 50pMA which is closely aligned with a major support and the 38% retrace of this wave up the channel. From there, I would watch for a test of the 50% retrace level at 1117. Depending on how quickly this takes place, we may or may not, have room to fall furhter within the up channel. The lowest point in the channel that I can see is around 1113. If we break that, back to the 1085 zone.

Good luck out there!

Monday, March 8, 2010

Just a day or so away...

There are really only two scenarios with the pattern we see today. Open the ES daily chart.


We are rising in a very steep channel that has not had the chance to form distinct upper and lower trend lines. This is steep and the volume of the rise does not equate to the volume on the downside. This is a bit bearish. We may even be able to argue that price action is wedging in the last 7 sessions or so. This too is bearish.

Bottom line is that we either breach the major resistance at 1147 area or we are rejected. The consolidation today favors a run at the high for sure. It also provides a spot to pause if the first attack fails. The attacks at the high can go on safely for about 2 weeks before we run horizontally into the current lower trend line of the current up channel. At that point, bears will have a chance of taking control again. If however, price action over powers resistance then you can expect a significant rally, turbo charged with short covering. As a rule, we would project price action to extend 38% beyond the high. I calculate somewhere in the neighborhood of 1213.50 on the futures.

As I look at this chart, I see decreasing volume during this attack of the highs - however it is too early to evaluate divergence of the RSI on the daily chart. I would not be surprised to see a failure at resistance on the first attempt. Repeated failures followed by a breach of the lower trend line of the current up channel will call for a test of support at 1113. If we fail to bounce at that level and start to sink lower, it is reasonable to add to short positions. The ultimate short signal would be generated if the 1040 low is breached.

Well, there you have my current outlook.

Good luck trading!

Saturday, March 6, 2010

To Double Top of Not?

Despite wanting to do more TA this week, I consciously held back.

The primary reason is that price action has been painfully obvious. Perhaps everyone in the world expects a test of the 1150 highs on the SPX - as they should based on the price patterns and support levels. Open the daily chart for the SPX:


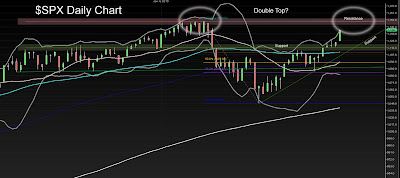
If we focus on the price action in November and December, we see that a trading range from roughly 085 to 1120 was in force. It was certainly volatile as well. We see large swings from bar to bar. This trading range represents the indecision of the market participants.

For the bears, the quick breach of support at 1120 and then 1085 - ON HIGH VOLUME - really suggested a trend reversal. That reversal had just about confirmed itself on February 5th when it touched as low as 1044 before the impressive intraday turn around. You can see that candle clearly on the chart.Since touching 1044, we have been on a steady climb.

Starting on Feb 16th, we climbed back into the 085-1120 channel. Volume increased and price action rose for 5 days. There was sufficient enough support to test resistance at 1115ish. The first attempt was met by the expected overhang supply and was rejected. The rejection is seen as the two consecutive down bars on Feb 22, 23. Price action found support at 092 and then at 1088ish a couple of days later. This support was right on the 20pMA. In fact, you can see the remarkable intra-day turn around candle touch the 20pMA and rocket directly afterwards.

The cup and handle pattern is pretty bullish and as soon as we broke 1115, it was clear that a full retrace of this throwback is likely. And that is where we stand today - on the verge of completing the retrace.

The real question now is will this be a double top? We shall see. Some things to look at in the coming week are volume, RSI and price action relative to the MAs. I will note that the 20pMA remains below the 50pMA. This is a bearish indicator. Also, Price action broke out above the 50pMA several days ago and is getting a bit ahead of itself. Seems to me that we will certainly see some form of throw-back near the 1150 highs with price action tending back towards the 50pMA.

I have provided all the levels that I think are relevant and tried to illustrate the setup. I hope this is helpful.

Good luck next week!